The recent market drawdown highlights risks of a concentrated S&P 500—and the case for diversification now.
At this point, most investors should be keenly aware of the outsized importance of a select group of stocks for the S&P 500. While the acronyms have changed, the current iteration is an amalgamation of giant market-leading companies taking part in the prevailing “AI” revolution. We’ll call them the “Elite 8” perhaps an apt comparison for this year’s March Madness tournament which has seen the favorites dominate the tournament. If you exclude Berkshire Hathaway, the elite 8 are the 8 largest US companies by market cap[1].
Recently, AssetMark published a piece urging investors to diversify in the face of this highly concentrated stock market[2], highlighting the historic levels of concentration with the below chart:
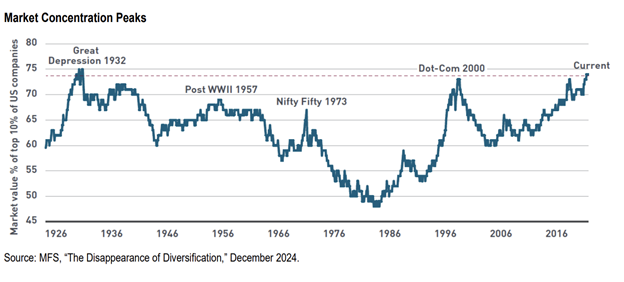
Perhaps unsurprisingly, concentration peaks are generally coincidental with market index peaks. Concentration is likely a key ingredient of market cycles and as concentration builds, the select group of concentrated stocks increasingly become the market.
Over the past 5 years[3] the “Elite 8” have increased their weight from 19% to 32.5% (and a peak of over 35%) and they have accounted for roughly 2/3rds of the entire return in the S&P 500. Thus far the market cap “let it ride” nature of the S&P 500 has been to the benefit of its investors, allowing the largest companies to continue to appreciate, but it has also allowed these companies to represent an outsized risk to portfolios going forward.
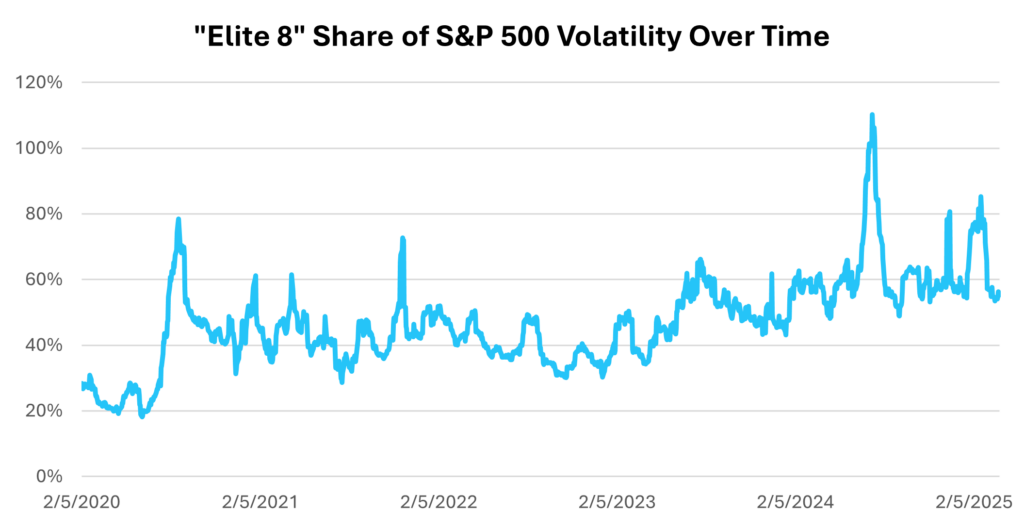
The Elite 8 are both volatile and highly correlated with one another, and increasingly so as the AI theme continues to bind their fates. Over the past year the average Elite 8 stock has exhibited a startlingly high 0.7 correlation with one another, higher still during the recent market pullback[4]. This means these individual stocks are often more closely related to one another than they are to the rest of their “sector” and far more correlated than the average S&P 500 sector is with one another. There is little diversification benefit within this group AND the group is a large part of the overall index, therefore the combined effect is a very outsized impact on contribution to market risk over time.
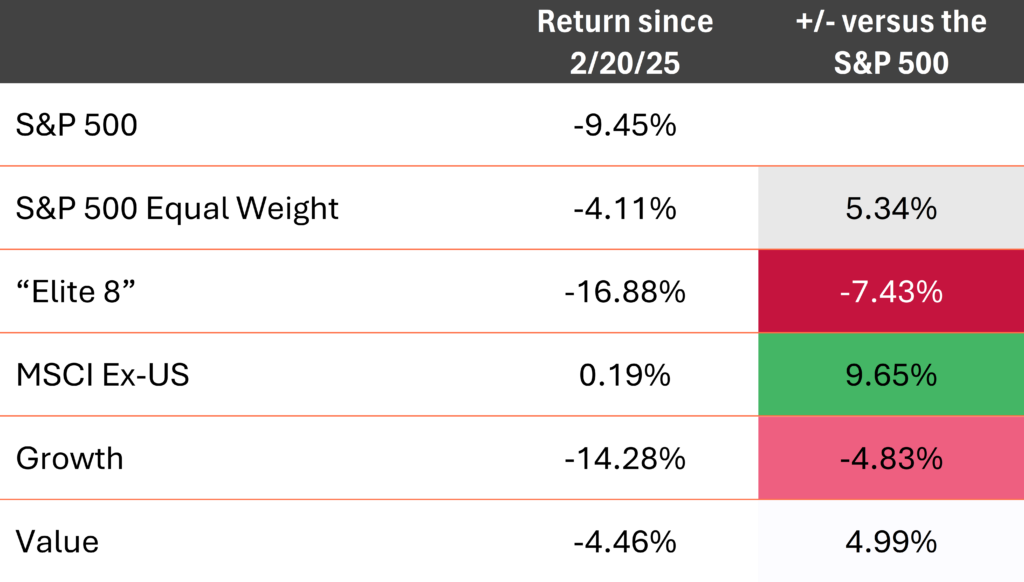
As AssetMark aptly stated, if you hold the S&P 500 you are no longer holding a highly diversified portfolio. While markets have risen, the higher-risk contribution has rarely affected investors. However, the recent pullback has perhaps “shown the market’s hand” as for what an extended market drawdown could look like. Nearly every major market “winning” trend has perfectly reversed:
In a recent quarterly letter, we used the Tech Bubble as a historical analogy highlighting how concentrated equity markets can create blind spots for investors focused on market capitalization-weighted indices. During the tech bubble, the ensuing massive drawdown in markets was primarily driven by the subset of internet stocks which had previously driven the market to its upward extremes. The average stock not only didn’t participate as much on the downside but actually realized decent returns over the period.

In this case, being underweight the largest companies had a massive positive impact to portfolios. Simply put, the more concentrated the market the more investors can benefit from diversification.
It’s too soon to say whether this drawdown marks the peak of market concentration, but it certainly highlighted the inclination of the market if there is continued weakness— and perhaps serves as a warning to investors that they may have more downside risk in simple market cap indices than they might expect.
Have you evaluated your client’s concentration risk yet?
If you’re a financial advisor, we can help! Contact us here.
[1] We are excluding Berkshire Hathaway because it is a holding company and despite its huge AAPL position is the only company in the top 9 of the S&P 500 not unified by the broad AI theme. The other companies AAPL, MSFT, NVDA, GOOG/GOOGL, AMZN, META, AVGO, and TSLA
[2] “On the Mark: Index Diversification?”, AssetMark, March 2025.
[3] 12/31/2019 through 3/31/2025, peak on 12/29/2024 at 36.8%.
[4] Starting February 20th, 2025 through March 31st 2025 and ongoing. Correlation data for the period 3/31/2024 through 3/31/2025.
Disclosures:
Copyright ©2025 Algorithmic Investment Models LLC (AIM). All rights reserved. All materials appearing in this commentary are protected by copyright as a collective work or compilation under U.S. copyright laws and are the property of Beaumont Capital Management. You may not copy, reproduce, publish, use, create derivative works, transmit, sell or in any way exploit any content, in whole or in part, in this commentary without express permission from Beaumont Capital Management.
Certain information contained herein constitutes “forward-looking statements,” which can be identified by the use of forward-looking terminology such as “may,” “will,” “should,” “expect,” “anticipate,” “project,” “estimate,” “intend,” “continue,” or “believe,” or the negatives thereof or other variations thereon or comparable terminology. Due to various risks and uncertainties, actual events, results or actual performance may differ materially from those reflected or contemplated in such forward-looking statements. Nothing contained herein may be relied upon as a guarantee, promise, assurance or a representation as to the future.
This material is provided for informational purposes only and does not in any sense constitute a solicitation or offer for the purchase or sale of a specific security or other investment options, nor does it constitute investment advice for any person. The material may contain forward or backward-looking statements regarding intent, beliefs regarding current or past expectations. The views expressed are also subject to change based on market and other conditions. The information presented in this report is based on data obtained from third party sources. Although it is believed to be accurate, no representation or warranty is made as to its accuracy or completeness.
The charts and infographics contained in this blog are typically based on data obtained from third parties and are believed to be accurate. The commentary included is the opinion of the author and subject to change at any time. Any reference to specific securities or investments are for illustrative purposes only and are not intended as investment advice nor are they a recommendation to take any action. Individual securities mentioned may be held in client accounts. Past performance is no guarantee of future results.
As with all investments, there are associated inherent risks including loss of principal. Stock markets, especially foreign markets, are volatile and can decline significantly in response to adverse issuer, political, regulatory, market, or economic developments. Sector and factor investments concentrate in a particular industry or investment attribute, and the investments’ performance could depend heavily on the performance of that industry or attribute and be more volatile than the performance of less concentrated investment options and the market as a whole. Securities of companies with smaller market capitalizations tend to be more volatile and less liquid than larger company stocks. Foreign markets, particularly emerging markets, can be more volatile than U.S. markets due to increased political, regulatory, social or economic uncertainties. Fixed Income investments have exposure to credit, interest rate, market, and inflation risk. Diversification does not ensure a profit or guarantee against a loss.
The S&P 500 Index is a market-capitalization-weighted index that tracks the performance of 500 of the largest publicly traded companies in the U.S. The S&P 500 Equal Weight Index assigns equal weights to each of the 500 companies in the S&P 500. The S&P 500 Technology Sector Index is a subset of the S&P 500 that includes companies classified within the Information Technology sector, as defined by the Global Industry Classification Standard (GICS). The Russell 1000 Growth Index measures the performance of large-cap U.S. companies with higher growth characteristics, such as higher forecasted earnings and revenue growth. The Russell 1000 Value Index measures the performance of large-cap U.S. companies with value-oriented characteristics, such as lower price-to-book ratios and lower expected growth rates. The MSCI Ex-US Index is a broad measure of global equity markets outside the United States. All index performance and statistics referenced are sourced from Bloomberg and AIM calculations for the period ending 3/31/2025. Indices are unmanaged and not available for direct investment. Past performance is no guarantee of future results.