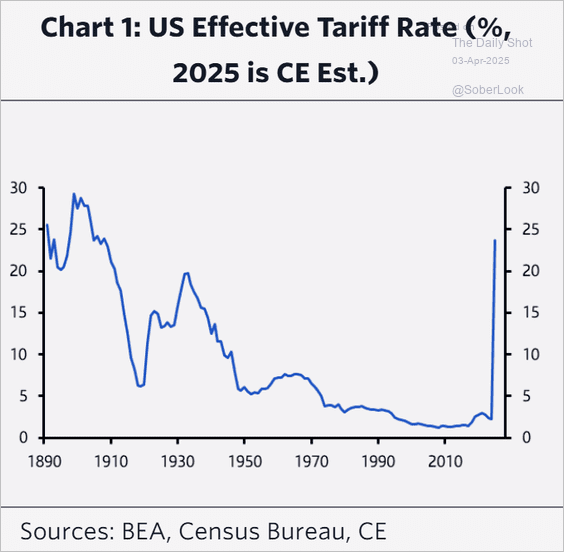
With the stroke of a pen, President Trump sent the effective tariff rate on U.S. imports to the highest level in over 100 years. Markets sold off sharply, with U.S. stocks leading the declines among major markets. Interest rates fell, and the market now expects more easing from the Federal Reserve in 2025. The Fed may find it challenging to cut aggressively without a further decline in inflation. CEOs are feeling less confident about the near-term business environment. International assets outperformed during the first quarter, but there’s been little change in the underlying fundamentals. American’s views on foreign trade may surprise you.
1. Putting opinions on the effectiveness of tariffs aside, it’s clear that this represents a paradigm change in global trade:
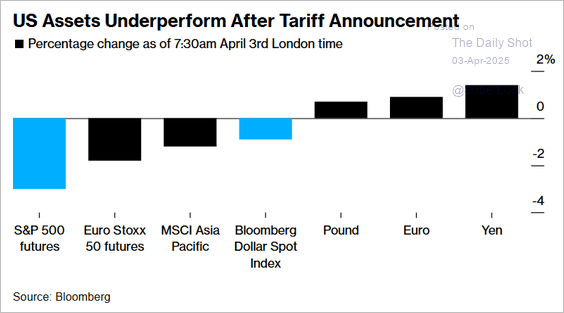
2. International equities fell less than U.S. equities in local currency, and the falling Dollar provided an additional boost:
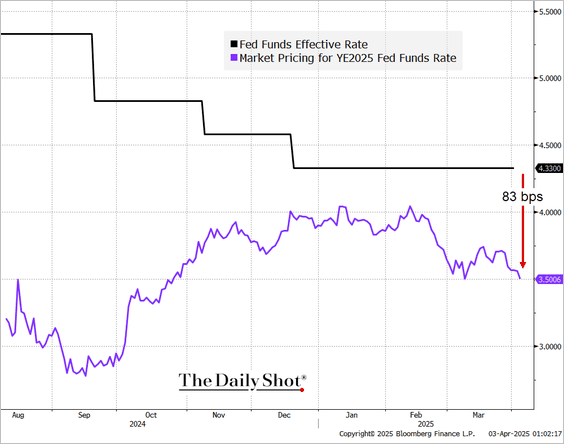
3. The market now expects three rate cuts in 2025:
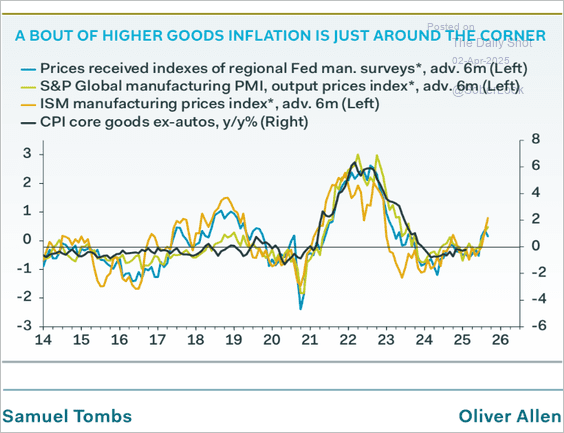
4. Manufacturing surveys suggest we may see a bout of goods inflation:
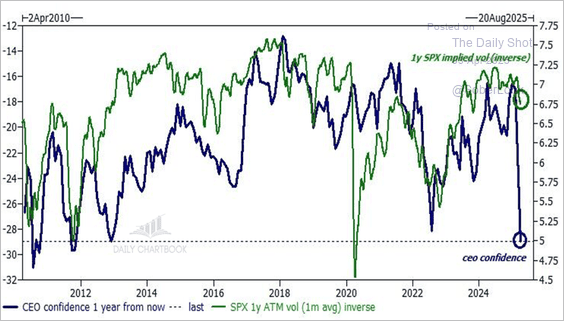
5. CEO confidence is currently materially lower than at any point during the first Trump administration, and slightly worse than the 2022 nadir during the Biden administration:
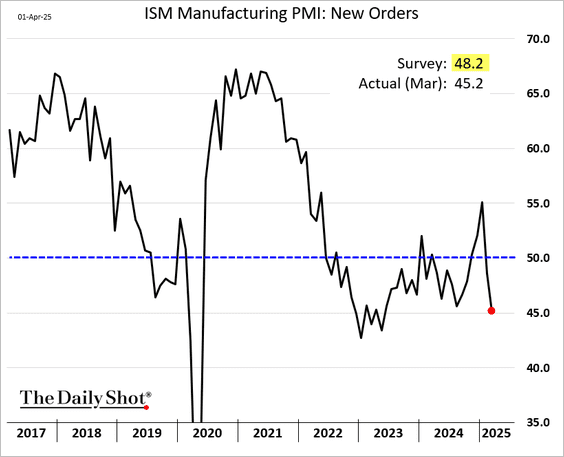
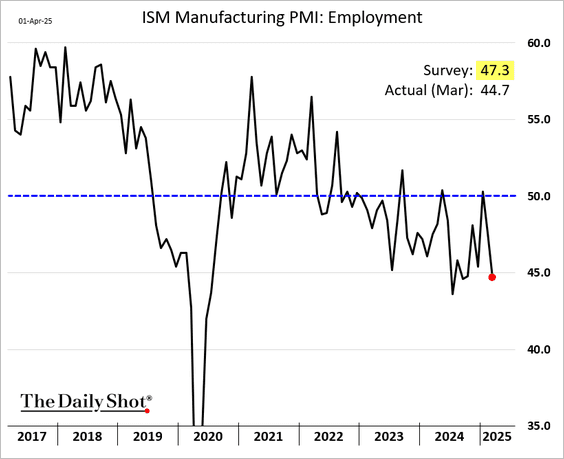
6. The lack of confidence is reflected in some of the more forward-looking components of recent ISM Manufacturing PMIs:
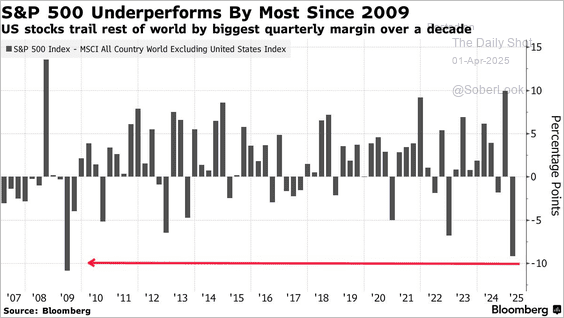
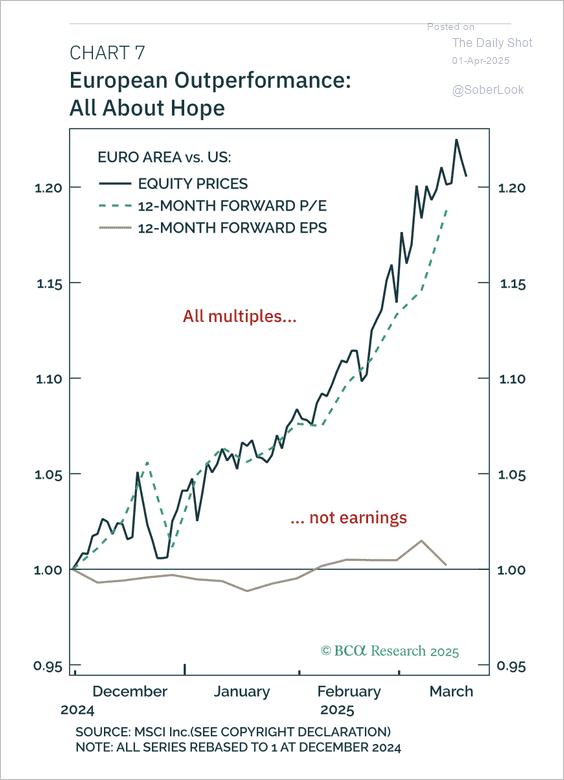
7. The significance of one quarter of underperformance for U.S. stocks highlights how dominant they have been over the past decade:
8. Increased government spending could be a real catalyst for continued European outperformance, but it will take time for the impact to flow through to earnings:
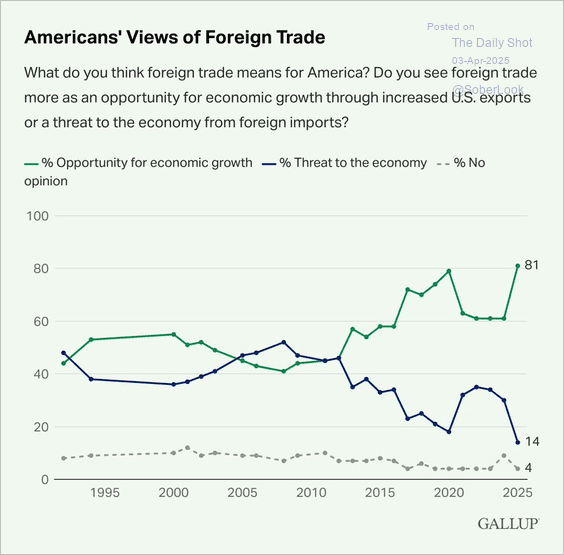
9. American’s overwhelmingly view foreign trade as an opportunity for economic growth:
Disclosures:
Copyright © 2025 Algorithmic Investment Models LLC (AIM). All rights reserved. All materials appearing in this commentary are protected by copyright as a collective work or compilation under U.S. copyright laws and are the property of Beaumont Capital Management. You may not copy, reproduce, publish, use, create derivative works, transmit, sell or in any way exploit any content, in whole or in part, in this commentary without express permission from Beaumont Capital Management.
Certain information contained herein constitutes “forward-looking statements,” which can be identified by the use of forward-looking terminology such as “may,” “will,” “should,” “expect,” “anticipate,” “project,” “estimate,” “intend,” “continue,” or “believe,” or the negatives thereof or other variations thereon or comparable terminology. Due to various risks and uncertainties, actual events, results or actual performance may differ materially from those reflected or contemplated in such forward-looking statements. Nothing contained herein may be relied upon as a guarantee, promise, assurance or a representation as to the future.
This material is provided for informational purposes only and does not in any sense constitute a solicitation or offer for the purchase or sale of a specific security or other investment options, nor does it constitute investment advice for any person. The material may contain forward or backward-looking statements regarding intent, beliefs regarding current or past expectations. The views expressed are also subject to change based on market and other conditions. The information presented in this report is based on data obtained from third party sources. Although it is believed to be accurate, no representation or warranty is made as to its accuracy or completeness.
The charts and infographics contained in this blog are typically based on data obtained from third parties and are believed to be accurate. The commentary included is the opinion of the author and subject to change at any time. Any reference to specific securities or investments are for illustrative purposes only and are not intended as investment advice nor are they a recommendation to take any action. Individual securities mentioned may be held in client accounts. Past performance is no guarantee of future results.
As with all investments, there are associated inherent risks including loss of principal. Stock markets, especially foreign markets, are volatile and can decline significantly in response to adverse issuer, political, regulatory, market, or economic developments. Sector and factor investments concentrate in a particular industry or investment attribute, and the investments’ performance could depend heavily on the performance of that industry or attribute and be more volatile than the performance of less concentrated investment options and the market as a whole. Securities of companies with smaller market capitalizations tend to be more volatile and less liquid than larger company stocks. Foreign markets, particularly emerging markets, can be more volatile than U.S. markets due to increased political, regulatory, social or economic uncertainties. Fixed Income investments have exposure to credit, interest rate, market, and inflation risk. Diversification does not ensure a profit or guarantee against a loss.
The federal funds rate is the interest rate at which banks lend money to each other overnight. A treasury yield is the interest rate the U.S. government pays on its debt, and the annual return that investors can expect from holding a U.S. government security.
Please contact your AIM Regional Consultant for more information or to address any questions that you may have.
Algorithmic Investment Models LLC (AIM), 125 Newbury St. 4th Floor, Boston, MA 02116 (844-401-7699)
The S&P 500 Index is a market-capitalization-weighted index of 500 leading publicly traded companies in the U.S. across various industries.