Trade talks between U.S. and Chinese officials are set for this weekend. Both sides seem to recognize that current tariff levels are “unsustainable,” and if the goal is de-escalation, we hope it can be done quickly. The labor market has softened compared to recent years, though there’s currently little cause for alarm. Federal layoffs are beginning to appear in payroll data. S&P 500 earnings revisions. Oil breakevens. The Dollar. The G.O.A.T.
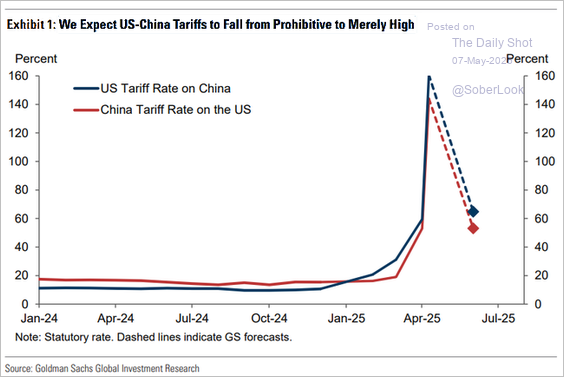
1. Current tariff levels have re-anchored expectations, but a 60% effective rate would still likely cause major disruptions:
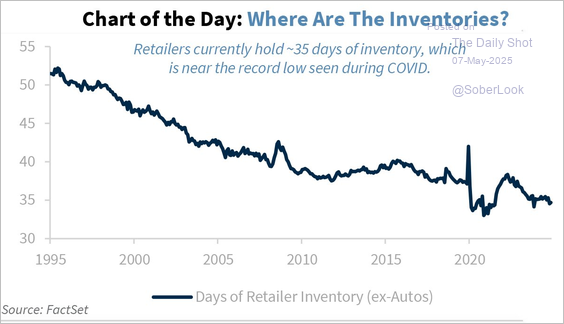
2. Retailers are stretching inventories as they hope for a trade deal:
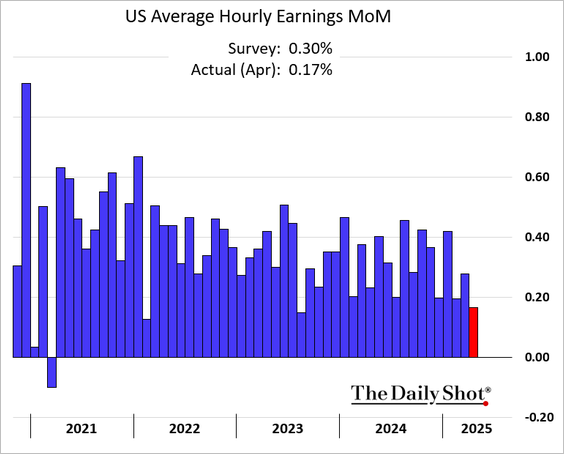
3. Less upward pressure on wages may help offset increases in goods prices from tariffs:
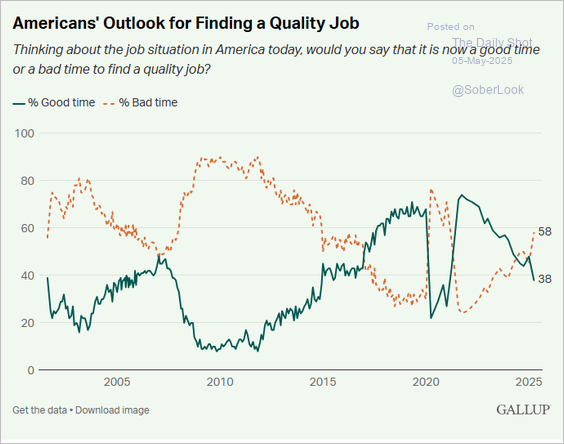
4. Americans’ current outlook for finding a quality job only looks particularly poor in comparison to recent years:
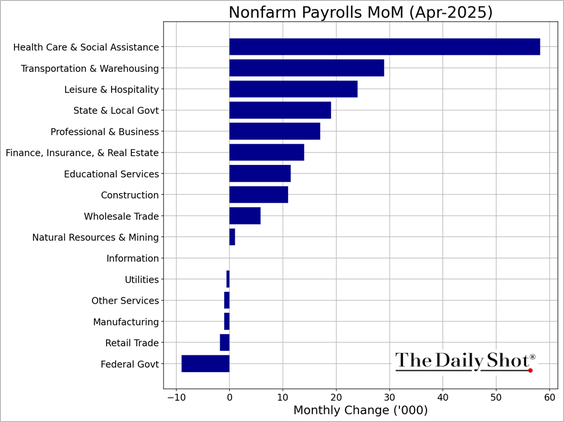
5. Federal layoffs remain modest compared to the pace of private sector job creation:
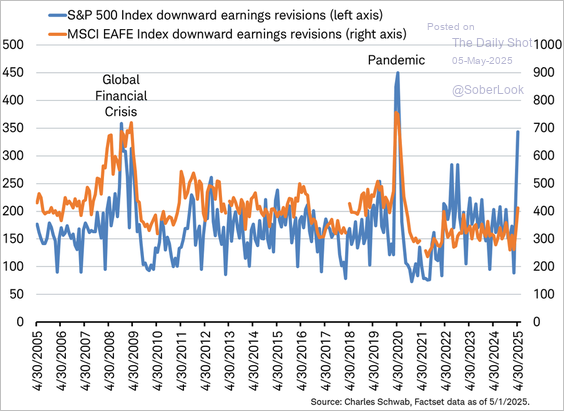
6. The earnings outlook is deteriorating:
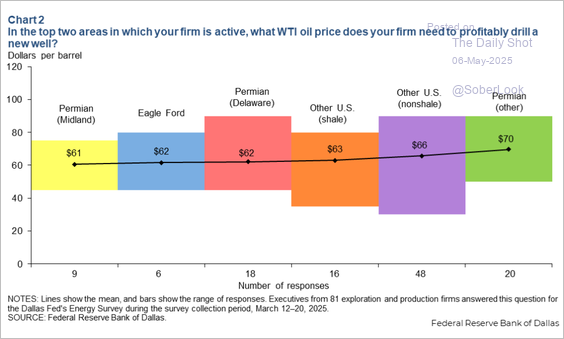
7. U.S. oil production is unlikely to increase at current prices:
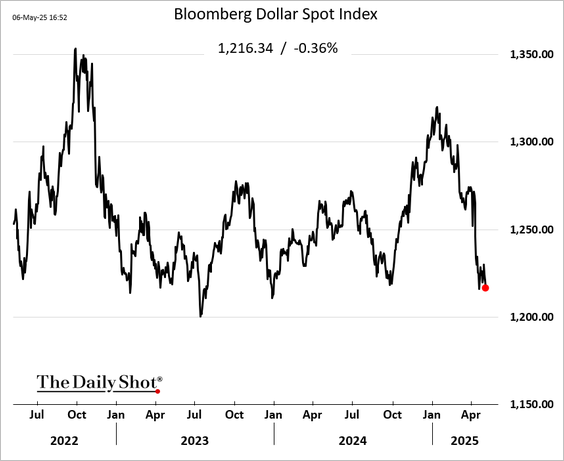
8. The Dollar hasn’t followed stocks higher:
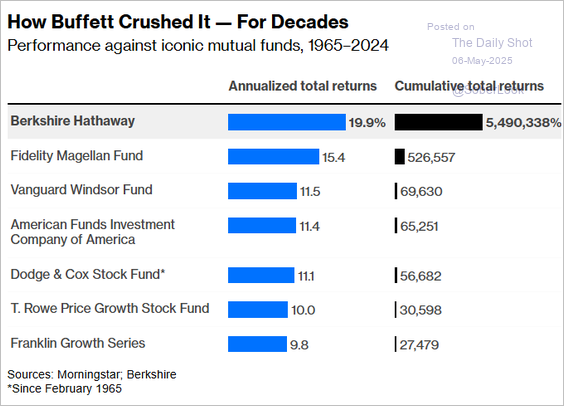
9. Warren Buffett is going out on top, announcing his retirement the day after Berkshire Hathaway hit an all-time high:
Disclosures:
Copyright © 2025 Algorithmic Investment Models LLC (AIM). All rights reserved. All materials appearing in this commentary are protected by copyright as a collective work or compilation under U.S. copyright laws and are the property of Beaumont Capital Management. You may not copy, reproduce, publish, use, create derivative works, transmit, sell or in any way exploit any content, in whole or in part, in this commentary without express permission from Beaumont Capital Management.
Certain information contained herein constitutes “forward-looking statements,” which can be identified by the use of forward-looking terminology such as “may,” “will,” “should,” “expect,” “anticipate,” “project,” “estimate,” “intend,” “continue,” or “believe,” or the negatives thereof or other variations thereon or comparable terminology. Due to various risks and uncertainties, actual events, results or actual performance may differ materially from those reflected or contemplated in such forward-looking statements. Nothing contained herein may be relied upon as a guarantee, promise, assurance or a representation as to the future.
This material is provided for informational purposes only and does not in any sense constitute a solicitation or offer for the purchase or sale of a specific security or other investment options, nor does it constitute investment advice for any person. The material may contain forward or backward-looking statements regarding intent, beliefs regarding current or past expectations. The views expressed are also subject to change based on market and other conditions. The information presented in this report is based on data obtained from third party sources. Although it is believed to be accurate, no representation or warranty is made as to its accuracy or completeness.
The charts and infographics contained in this blog are typically based on data obtained from third parties and are believed to be accurate. The commentary included is the opinion of the author and subject to change at any time. Any reference to specific securities or investments are for illustrative purposes only and are not intended as investment advice nor are they a recommendation to take any action. Individual securities mentioned may be held in client accounts. Past performance is no guarantee of future results.
As with all investments, there are associated inherent risks including loss of principal. Stock markets, especially foreign markets, are volatile and can decline significantly in response to adverse issuer, political, regulatory, market, or economic developments. Sector and factor investments concentrate in a particular industry or investment attribute, and the investments’ performance could depend heavily on the performance of that industry or attribute and be more volatile than the performance of less concentrated investment options and the market as a whole. Securities of companies with smaller market capitalizations tend to be more volatile and less liquid than larger company stocks. Foreign markets, particularly emerging markets, can be more volatile than U.S. markets due to increased political, regulatory, social or economic uncertainties. Fixed Income investments have exposure to credit, interest rate, market, and inflation risk. Diversification does not ensure a profit or guarantee against a loss.
The federal funds rate is the interest rate at which banks lend money to each other overnight. A treasury yield is the interest rate the U.S. government pays on its debt, and the annual return that investors can expect from holding a U.S. government security. The U.S. Dollar Index is a geometrically-averaged calculation of six currencies weighted against the U.S. dollar. Regional manufacturing future capex indexes are surveys conducted by Federal Reserve Banks that gauge the outlook for capital expenditures (CapEx) in the manufacturing sector within specific regions. These indexes, like the Dallas Fed Manufacturing Survey, Empire State Manufacturing Survey, and Philly Fed Manufacturing Business Outlook Survey, measure the percentage of manufacturers reporting that they expect to increase or decrease their capital spending over the next few months.
Please contact your AIM Regional Consultant for more information or to address any questions that you may have.
Algorithmic Investment Models LLC (AIM), 125 Newbury St. 4th Floor, Boston, MA 02116 (844-401-7699)
The S&P 500 Index is a market-capitalization-weighted index of 500 leading publicly traded companies in the U.S. across various industries.